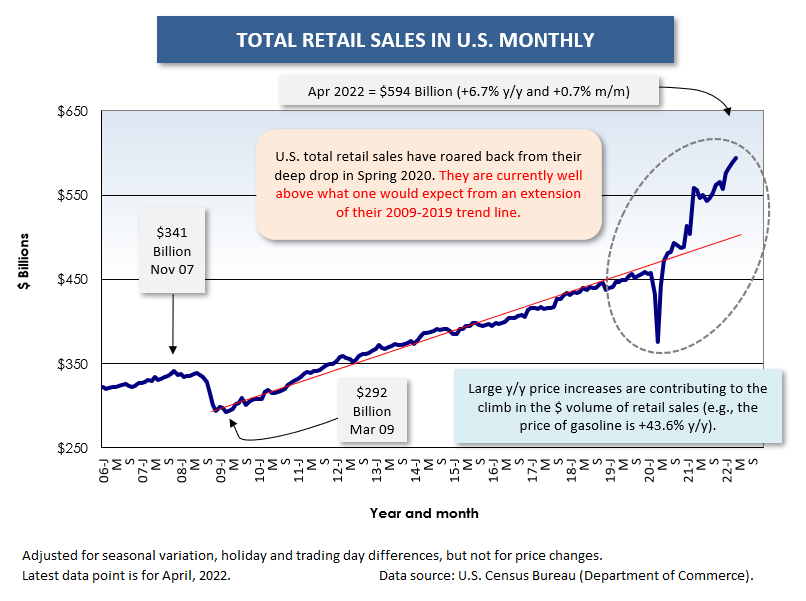
The importance of retail trade for the overall U.S. economy is readily apparent. Consumer spending always accounts for about 70% of gross domestic product (GDP). In turn, retail activity is usually between 40% and 45% of consumer spending.
 Therefore, retail trade is just a little less than a third of GDP.
For the construction sector, there are several important aspects to retail trade.
The building of ‘bricks and mortar’ locations will affect °µÍø½ûÇøConnect’s ‘starts’ statistics and the Census Bureau’s ‘put-in-place’ investment numbers.
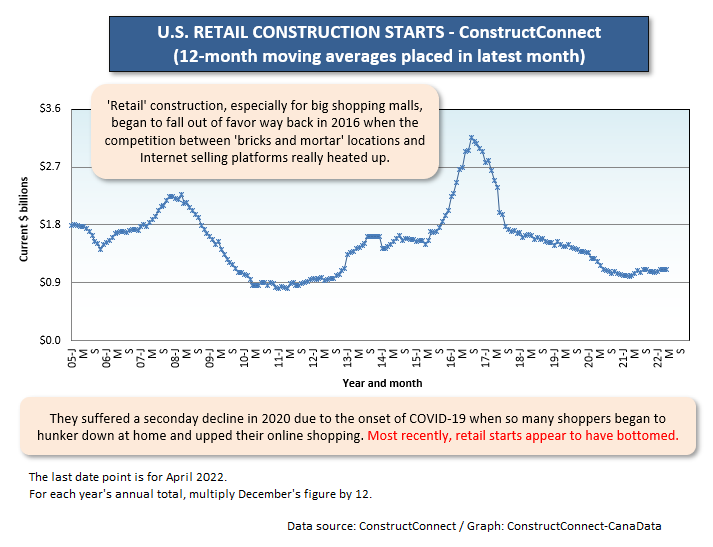
Graph 1 shows that retail starts statistics achieved one cyclical peak in late 2007-early 2008, immediately prior to the turndown referred to as ‘The Great Recession’, lasting for the six consecutive quarters through Q2 2019. (The ‘Great Recession’ was the financial crisis initiated by the subprime mortgage imbroglio.)
Retail construction starts stayed sluggish for years, but then soared again in much of 2015 and early 2016. Big shopping mall construction was still in fashion, although talk of how sales made by Internet platforms were making serious inroads into the receipts rung up by traditional sellers was certainly heating up.
After early 2016, retail construction starts went into a deep dive. The slope of that descent leveled out a bit in 2018 and 2019, but then it steepened again in 2020. The 2020 secondary plummet was initiated by the arrival of COVID-19. Stay-at-home directives had nearly everyone hunkering down in-doors and one major offshoot was a surge in all manner of purchases carried out digitally or electronically. Ìý
The incredible leap in sales made by ‘non-stores’ from Spring 2020 on jumps out of Graph 5.
Returning to Graph 1, however, it now appears retail construction starts have finally touched bottom and may be prepping for a mild revival.
The word ‘mild’ probably applies because one shouldn’t expect the love affair with shopping online to dissipate much. It’s just so convenient. Plus, there’s such an enormity of choices. And it makes price comparisons so simple.
Nevertheless, the physical act of browsing up and down aisles holds appeal as well. Many individuals and families derive leisure-time entertainment from window shopping, especially when they can also enjoy a visit to a food court or arrange a dining out experience with friends.
‘Bricks and mortar’ vendors have learned one valuable lesson while competing with e-sellers for traction, that it’s important to provide a pleasurable experience.
°µÍø½ûÇøConnect’s ‘retail/shopping’ starts in dollar volume terms are +12.7% through the first four months of this year versus Jan-Apr 2021. The Census Bureau’s ‘put-in-place’ commercial numbers (which combine retail; warehouses; car dealerships and garages; and restaurants, bars) are +20.5% year to date through April. A great deal of warehouse work has been carried forward into the present year from groundbreakings earlier.
Building Material Suppliers
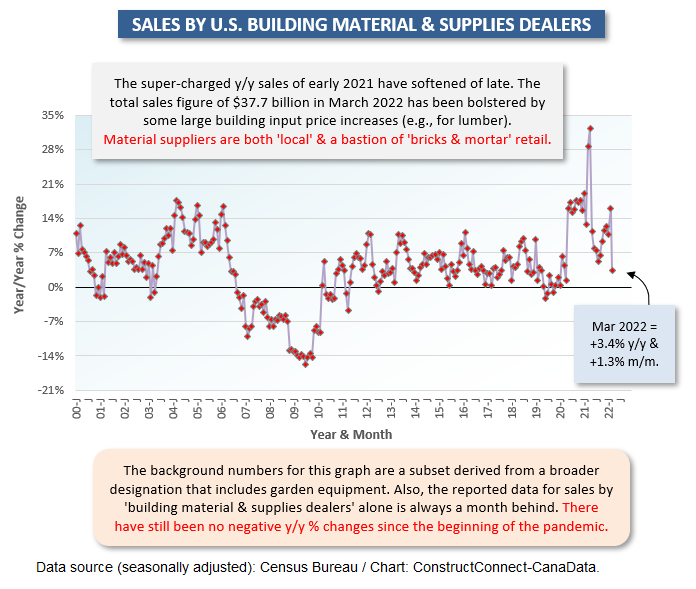
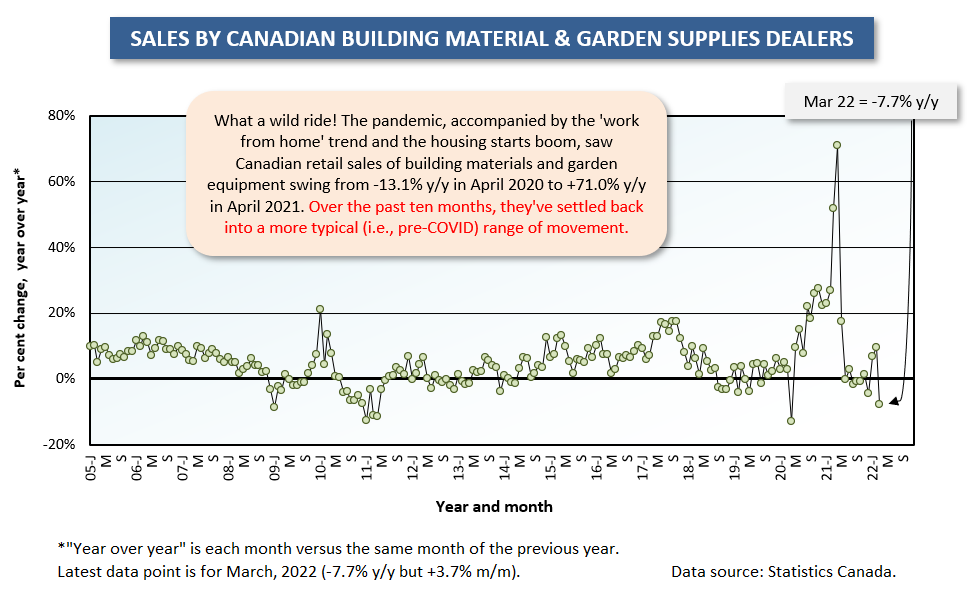
Another interesting aspect for construction to be found in the retail numbers relates to sales by building material suppliers. The year-over-year results appear in Graph 3 for U.S. firms and in Graph 9 for Canadian entities.
There have been two props to building material sales over the past two years of pandemic. Stay-at-home do-it-yourselfers have gone all in on improvement projects. Also, dollar sales volumes have been mightily lifted by stunning price increases across a wide spectrum of construction inputs.
Bars and Restaurants
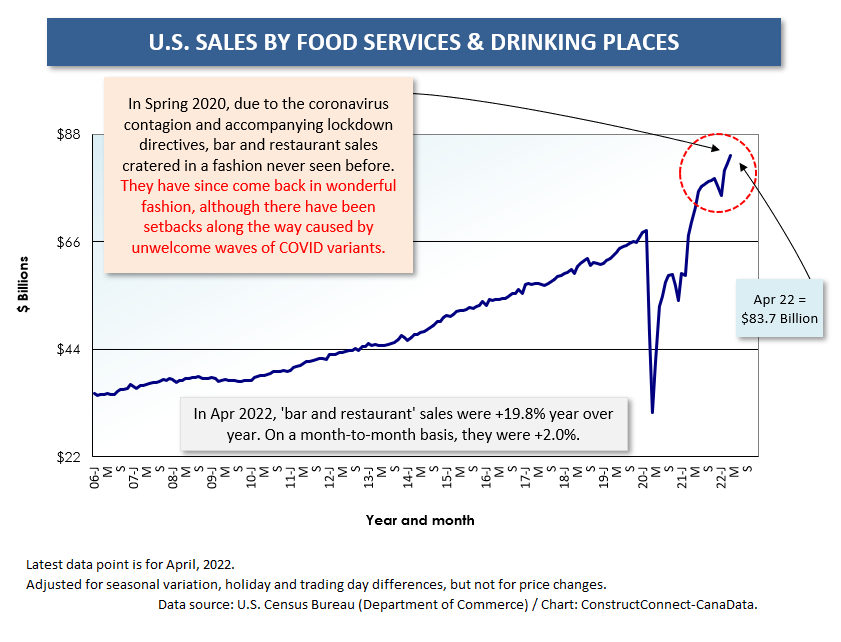
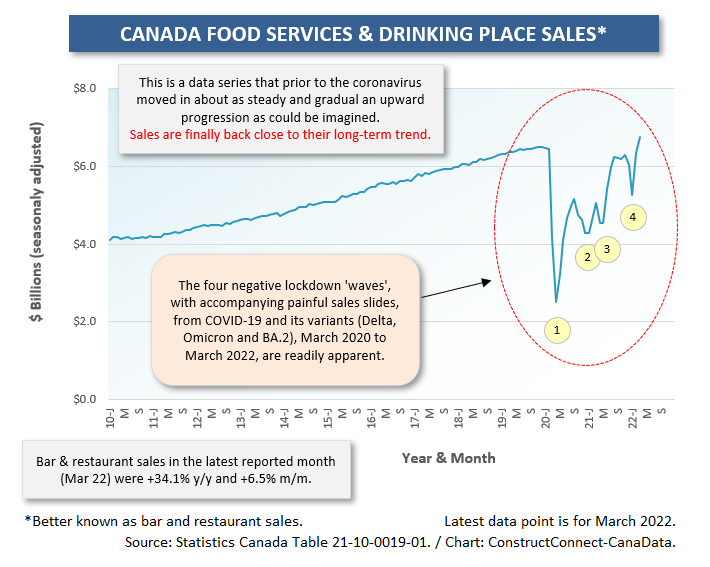
Finally, while food service and drinking place sales are not part of retail sales, they are usually assessed at the same time by analysts (and are presented in the same monthly report by the Census Bureau).
There were no other pockets of the economy that saw nosedives in activity like bars and restaurants in 2020. On the flip side, there may be no better indication of whether the economy has returned to normal than to look at how bistro and bar owners are faring now.
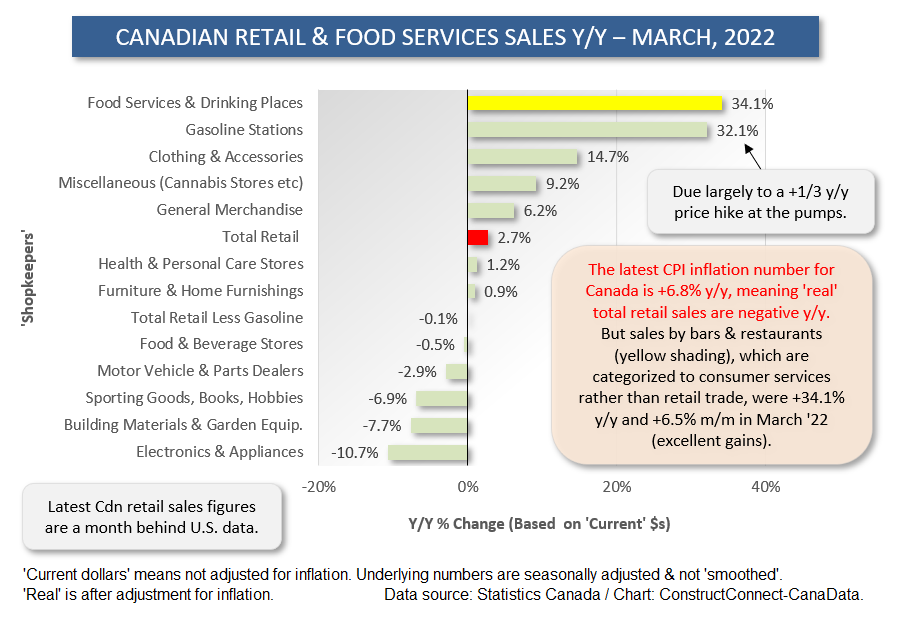
On that score, the news is splendid. Graph 4 shows the U.S. with resounding results and Graph 10 highlights a Canadian pickup that is almost fully back to where it should be.
Graph 1
Graph 2
Graph 3
Graph 4
Graph 5
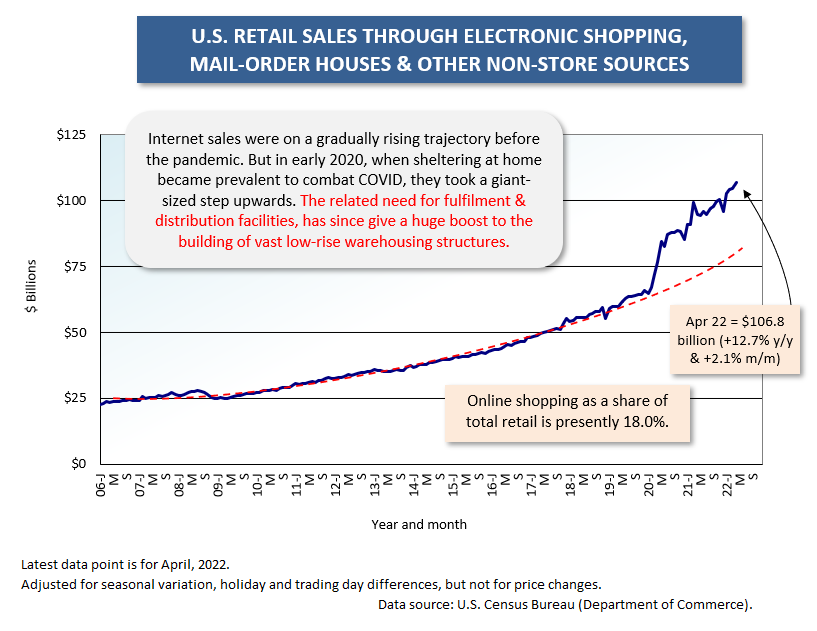
Graph 6
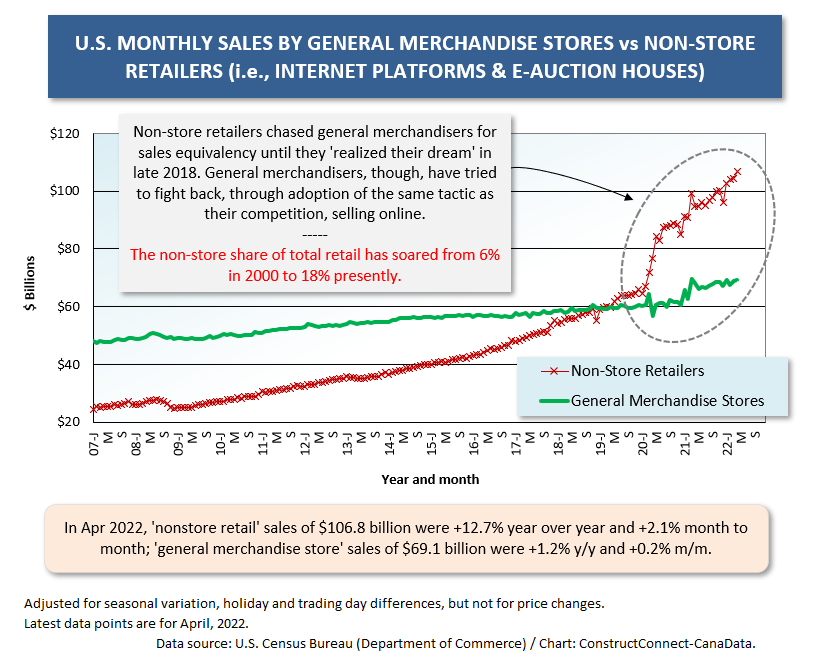
Graph 7
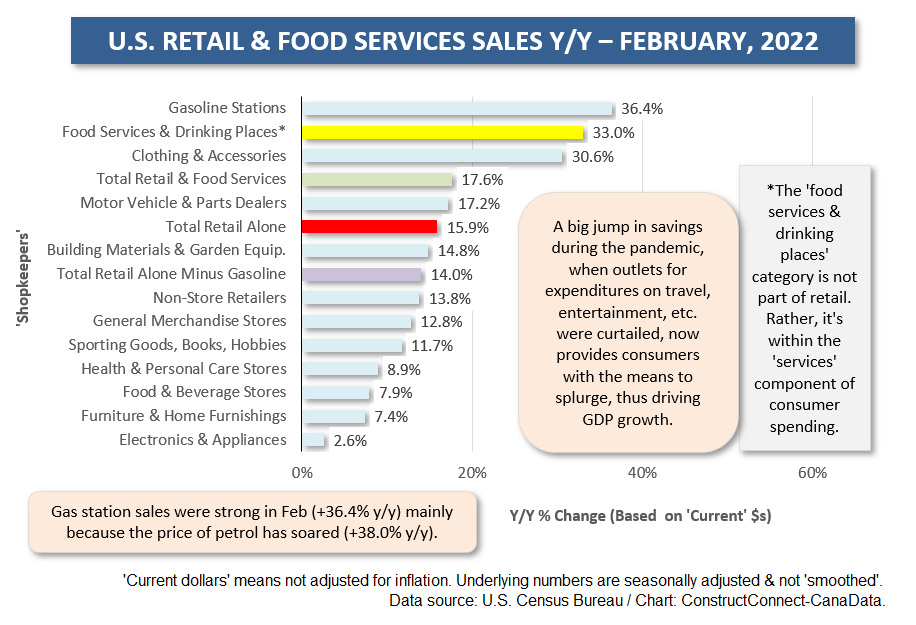
Graph 8
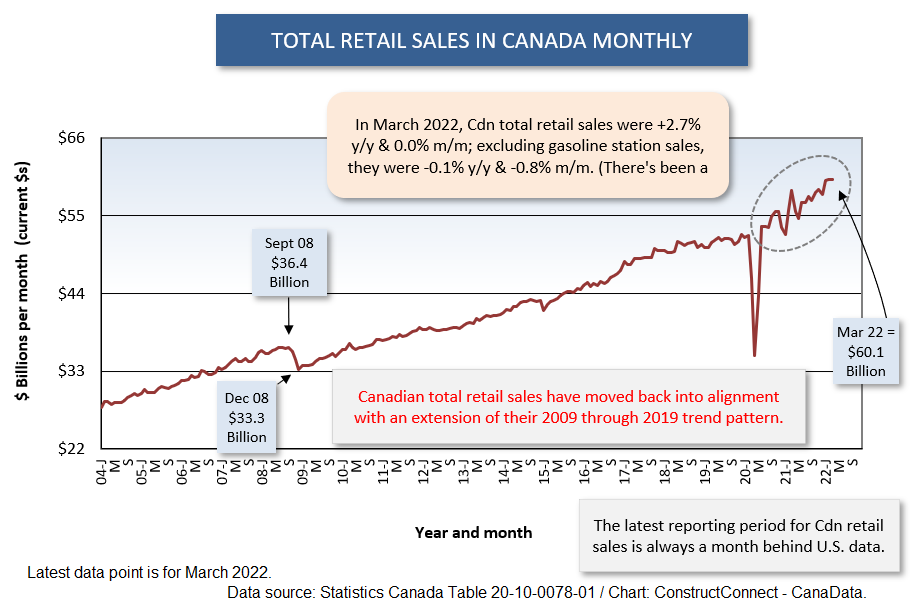
Graph 9
Graph 10
Graph 11
Alex Carrick is Chief Economist for °µÍø½ûÇøConnect. He has delivered presentations throughout North America on the U.S., Canadian and world construction outlooks. Mr. Carrick has been with the company since 1985. Links to his numerous articles are featured on TwitterÌý, which has 50,000 followers.


Recent Comments
comments for this post are closed