The U.S. economy grew by +2.0% in the first quarter of this year and by +2.4% in the second quarter. Those figures are the month-to-month annualized percentage changes of ‘real’ (i.e., inflation-adjusted) gross domestic product (GDP) dollars.
One should not, however, grow comfortable with the thought that all is well, and a slowdown or recession has been averted.
 A key component of GDP is consumer spending, which is almost half comprised of retail sales. While total retail sales are not in deep distress, they are certainly not as buoyant as they were a year or so ago.
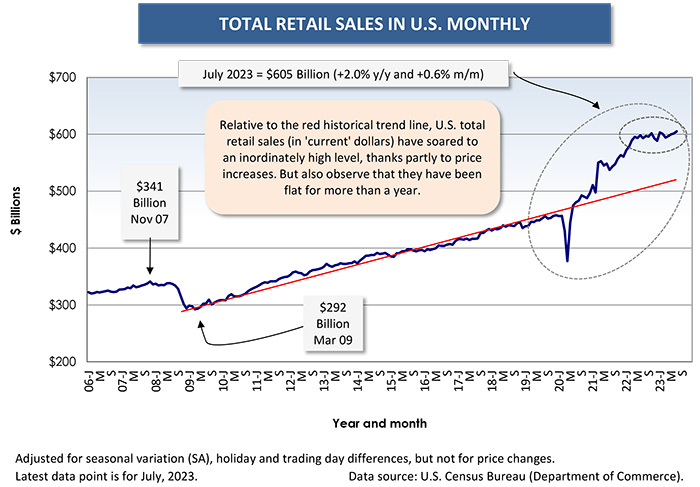
In fact, total current dollar retail sales have been flat for a year and a half (see Graph 1). On a year-over-year basis in the latest reported month, July 2023, they were +2.0%. With inflation still running over +3.0% y/y, the difference means ‘real’ total retail sales were slightly negative.
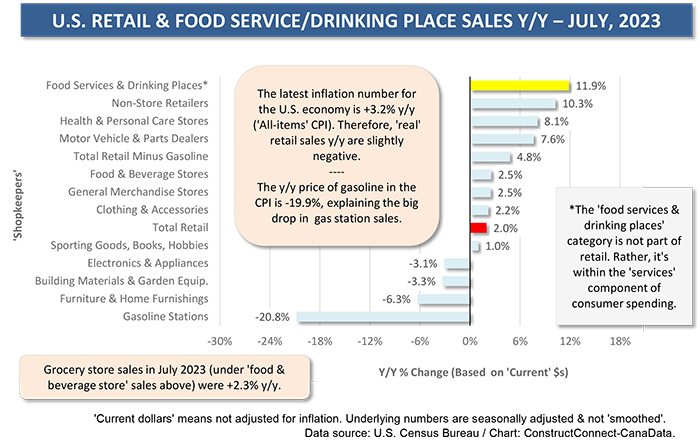
There is a wrinkle in this narrative. Total retail sales are being substantially suppressed by the weakness of receipts at gasoline stations, -20.8% y/y. Again, there is an inflation twist. The steep slide in petrol sales ties directly to a -19.9% y/y change in the price of gasoline, according to the latest Consumer Price Index (CPI) data set.
Interestingly, the y/y percentage change in total retail sales less gas stations is +4.8% while the y/y CPI change leaving out energy is +4.7%. It appears that y/y retail sales, under the best interpretation, are remaining flat. Nevertheless, this is not conducive to GDP growth.
By the ay, the price break for gasoline has ended. Saudi Arabia has instituted production cuts that have lifted the global price for crude back above $90 USD per barrel.
Health and personal care store sales are presently +8.1% year over year. This is a sub-category of retail that traditionally does well when the economy is struggling. Consumers scale down their purchases from big ticket items, such as furniture and appliances (which often carry loan commitments) to smaller things (e.g., cosmetics) that give them pleasure.
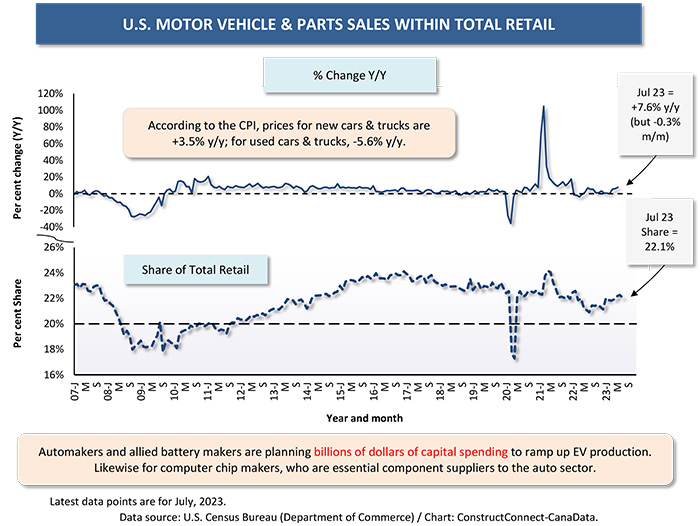
Sales by motor vehicle and parts dealers are +7.6% y/y. Nor is that climb beholden to price increases. According to the relevant CPI line items, the current sticker ‘shock’ for new vehicles isn’t so shocking after all, at +3.5% y/y. And for used cars and trucks, the price change is on the downside, -5.6% y/y.
But sales in this retail sector may well be headed for a collision. Autoworkers have big expectations for wage and benefit improvements when new contract negotiations turn heated in mid-September. Their resolve on picket lines, if it comes to that, could be a major determinant of how the U.S. economy performs overall in Q3.
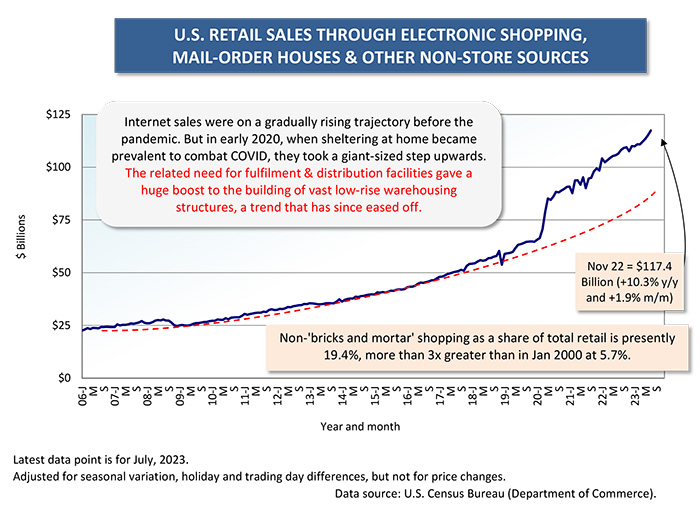
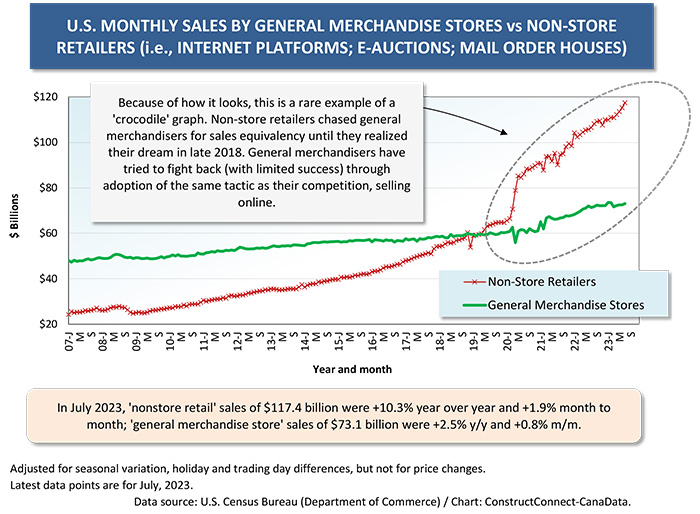
Sales by non-store retailers are still going gangbusters, +10.3% y/y. Internet, auction house, and mail order sales as a share of total retail are now nearly one-fifth (19.4%). At the turn of the century, they were less than 6%.
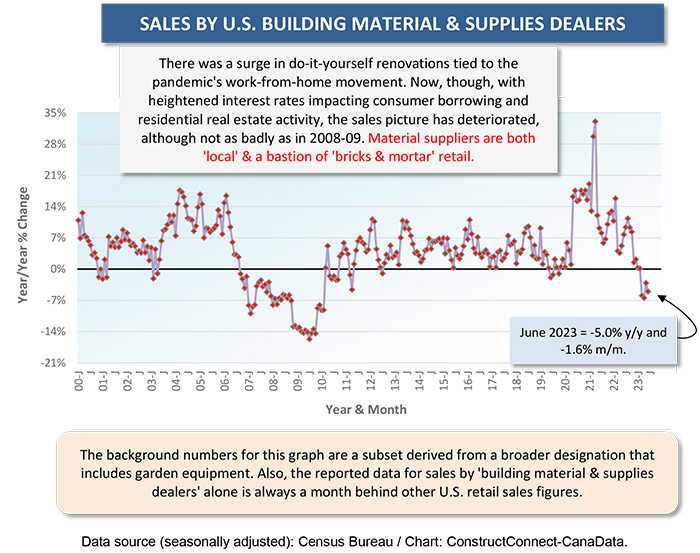
Tying directly into construction activity are sales by building material and supplies dealers. They’ve been under water, on a year-over-year basis, since the beginning of 2023, although they’re not as severely depressed as during the 2008-2009 recession.
An end to interest rate hikes and a return of housing starts to a decent level (1.5-1.6 million units annually) would be good for building material suppliers. As for the do-it-yourself reno brigade, they’ll be waiting for an easing of interest rates before they swing back into action.
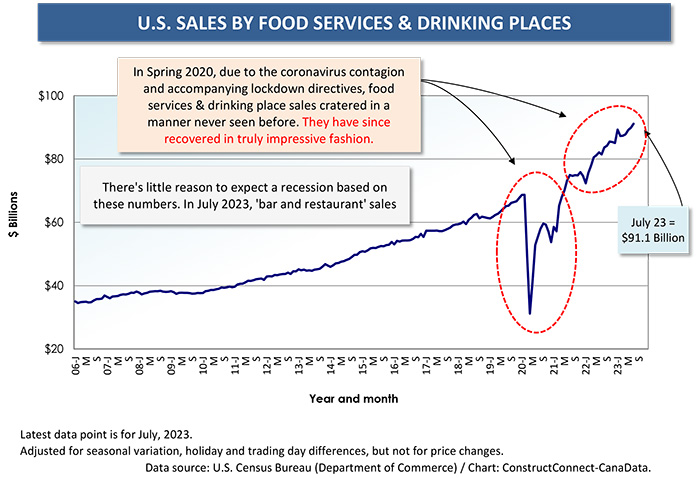
Finally, as Graph 7 shows, there has been no let-up in a category of consumer spending that lies outside retail, but is closely aligned with it (e.g., think stopping for lunch while shopping), food services and drinking places (otherwise known as bars and restaurants). Patrons in those establishments, after having been forced out of their seats in the COVID days, have returned in droves.
Graph 1
Graph 2
Graph 3
Graph 4
Graph 5
Graph 6
Graph 7
Alex Carrick is Chief Economist for °µÍø½ûÇøConnect. He has delivered presentations throughout North America on the U.S., Canadian and world construction outlooks. Mr. Carrick has been with the company since 1985. Links to his numerous articles are featured on TwitterÌý, which has 50,000 followers.




Recent Comments
comments for this post are closed