Due to its complexity, much of the subject matter concerning the economy requires detailed editorial commentary, often supported by relevant tables and graphs.
At the same time, though, there are many topics (e.g., relating to demographics, housing starts, etc.) that cry out for compelling ‘shorthand’ visualizations.
Whichever path is followed, the point of the journey, almost always, is to reach a bottom line or two.
To provide additional value, °µÍø½ûÇøConnect is now pleased to offer an ongoing series of 1,000-word charts.
These will help readers sort out the ‘big picture’ more clearly.
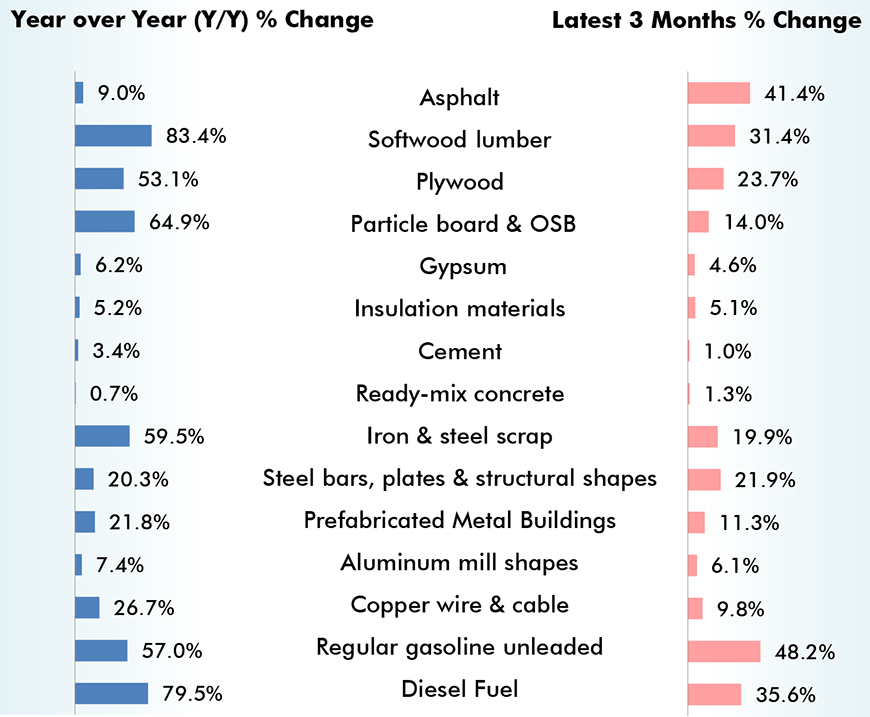
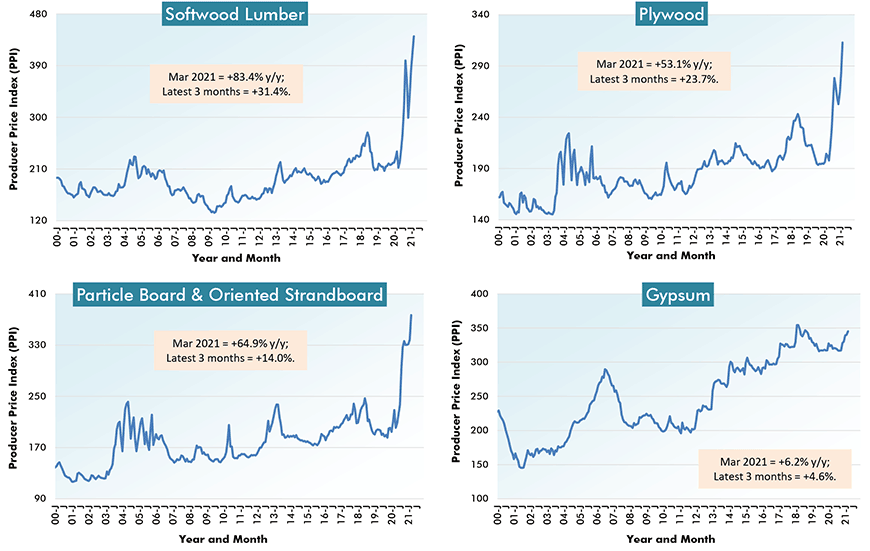
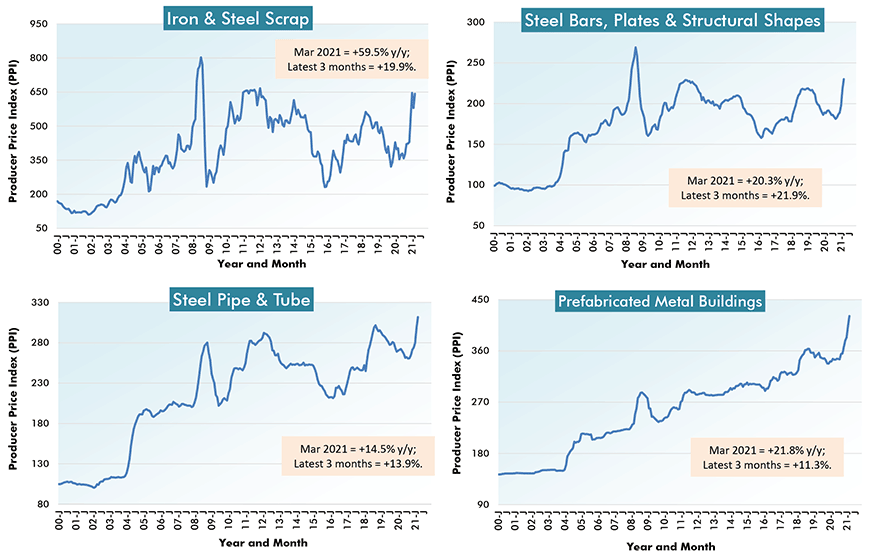
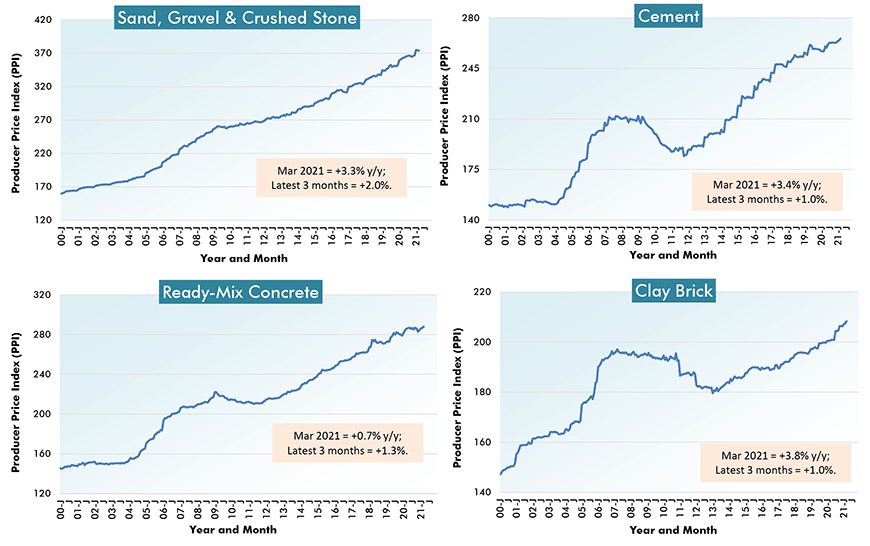
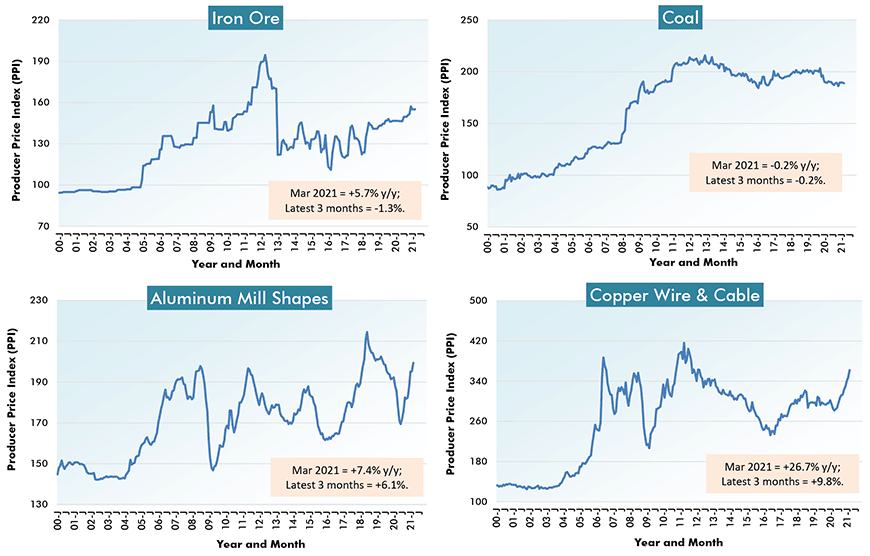
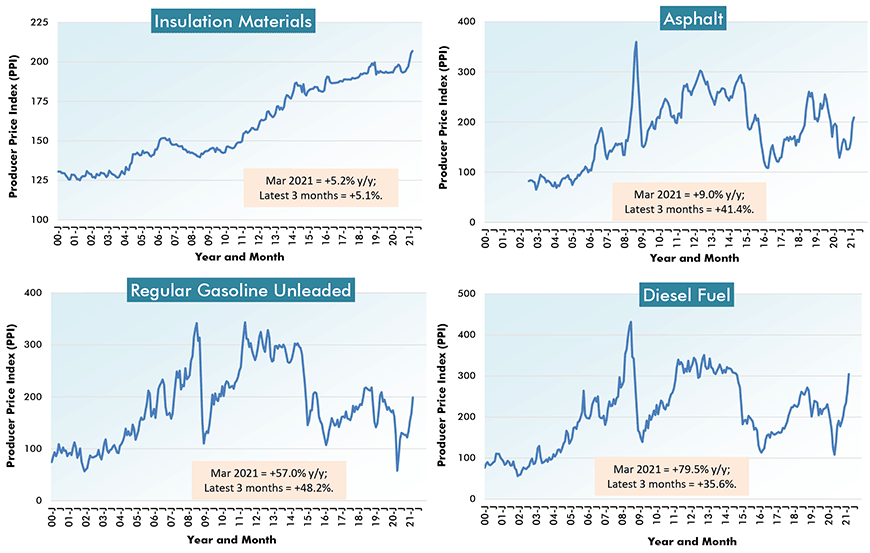
These 1,000-word charts look at U.S. (as of March 2021) and Canadian (as of February 2021) construction material costs.
From Producer Price Index (PPI) Series – March 2021
Charts: °µÍø½ûÇøConnect.
Charts: °µÍø½ûÇøConnect.
Charts: °µÍø½ûÇøConnect.
Charts: °µÍø½ûÇøConnect.
Charts: °µÍø½ûÇøConnect.
Charts: °µÍø½ûÇøConnect.
% Change in the March 2021 Index from:
| 3 Years | 1 Year | 6 months | 3 months | 1 month | |||||
| Ago | Ago | Ago | Ago | Ago | |||||
| Final Demand/Service/Commodity/Energy/Input: | |||||||||
| Final Demand °µÍø½ûÇøion | 10.5% | 1.5% | 0.9% | 0.9% | 0.5% | ||||
| New warehouse building construction | 8.1% | -0.3% | 0.6% | 0.2% | 0.3% | ||||
| New school building construction | 11.0% | 1.0% | 0.0% | 0.3% | 0.0% | ||||
| New office building construction | 12.6% | 3.3% | 2.9% | 2.6% | 1.6% | ||||
| New industrial building construction | 12.3% | 1.9% | 0.4% | 0.4% | 0.1% | ||||
| New health care building construction | 9.0% | 0.8% | 0.1% | 0.3% | 0.3% | ||||
| Architectural & engineering services | 5.1% | 1.5% | 2.5% | 1.6% | 0.0% | ||||
| °µÍø½ûÇøion machinery & equipment | 9.4% | 1.4% | 1.4% | 1.3% | 0.1% | ||||
| Asphalt | 15.9% | 9.0% | 28.7% | 41.4% | 4.9% | ||||
| Plastic construction products | 13.4% | 10.4% | 8.4% | 5.2% | 3.2% | ||||
| Softwood lumber | 73.4% | 83.4% | 10.6% | 31.4% | 6.8% | ||||
| Hardwood lumber | 12.3% | 27.3% | 25.9% | 15.4% | 9.0% | ||||
| Millwork | 17.2% | 12.3% | 5.6% | 5.3% | 1.7% | ||||
| Plywood | 32.3% | 53.1% | 12.4% | 23.7% | 10.5% | ||||
| Particle board & oriented strandboard (OSB) | 64.8% | 64.9% | 15.4% | 14.0% | 11.3% | ||||
| Gypsum | -2.6% | 6.2% | 8.9% | 4.6% | 1.4% | ||||
| Insulation materials | 7.7% | 5.2% | 6.9% | 5.1% | 0.7% | ||||
| °µÍø½ûÇøion sand, gravel & crushed stone | 12.7% | 3.3% | 2.2% | 2.0% | -0.2% | ||||
| Cement | 6.5% | 3.4% | 1.0% | 1.0% | 0.5% | ||||
| Ready-mix concrete | 4.8% | 0.7% | 0.3% | 1.3% | 0.4% | ||||
| Precast concrete products | 13.5% | 3.7% | 3.6% | 0.6% | 0.2% | ||||
| Prestressed concrete products | 6.9% | 0.6% | 1.7% | 1.7% | 0.7% | ||||
| Brick (clay) | 6.5% | 3.8% | 1.8% | 1.0% | 0.4% | ||||
| Coal | -5.5% | -0.2% | -0.1% | -0.2% | -0.2% | ||||
| Iron ore | 25.3% | 5.7% | 3.6% | -1.3% | 0.0% | ||||
| Iron & steel scrap | 20.0% | 59.5% | 52.6% | 19.9% | 10.8% | ||||
| Steel bars, plates & structural shapes | 19.7% | 20.3% | 26.9% | 21.9% | 6.0% | ||||
| Steel pipe & tube | 20.7% | 14.5% | 19.5% | 13.9% | 4.5% | ||||
| Fabricated structural metal products | 14.2% | 9.4% | 9.4% | 7.4% | 3.3% | ||||
| Prefabricated Metal Buildings | 22.7% | 21.8% | 18.7% | 11.3% | 4.2% | ||||
| Aluminum mill shapes | 0.8% | 7.4% | 9.3% | 6.1% | 2.1% | ||||
| Flat glass | 5.7% | 3.2% | 3.2% | 0.6% | 1.3% | ||||
| Paints, architectural coatings | 16.3% | 5.3% | 1.7% | 1.7% | 1.9% | ||||
| Lighting fixtures | 10.0% | 1.4% | 1.2% | 0.6% | 0.4% | ||||
| Plumbing fixtures & fittings | 8.9% | 1.9% | 1.3% | 1.3% | 0.8% | ||||
| Elevators & escalators | 8.1% | 1.2% | 1.2% | 1.2% | -0.3% | ||||
| Heating equipment | 12.5% | 2.6% | 2.5% | 2.0% | 0.6% | ||||
| Air conditioning equipment | 12.2% | 4.5% | 3.6% | 3.2% | 1.0% | ||||
| Copper wire & cable | 20.2% | 26.7% | 16.0% | 9.8% | 4.1% | ||||
| Regular gasoline unleaded | 7.9% | 57.0% | 56.8% | 48.2% | 17.8% | ||||
| Diesel Fuel | 35.5% | 79.5% | 71.6% | 35.6% | 15.4% | ||||
| Inputs to new construction | 16.3% | 13.5% | 7.6% | 7.5% | 2.6% | ||||
| Inputs to new residential construction | 16.9% | 14.3% | 6.2% | 7.6% | 2.4% | ||||
| Inputs to new non-res construction | 15.4% | 12.4% | 9.2% | 7.2% | 2.7% | ||||
| Inputs to commercial construction | 14.8% | 11.2% | 8.9% | 6.5% | 2.5% | ||||
| Inputs to healthcare structures | 15.2% | 12.0% | 8.3% | 6.5% | 2.5% | ||||
| Inputs to industrial structures | 15.4% | 10.6% | 9.2% | 6.2% | 2.1% | ||||
| Inputs to highways & streets | 12.6% | 10.2% | 9.1% | 6.8% | 2.6% | ||||
| Inputs to power & communication structures | 13.9% | 12.5% | 9.9% | 7.5% | 2.9% | ||||
| Inputs to educational & vocational structures | 16.3% | 12.6% | 8.1% | 6.7% | 2.6% | ||||
| °µÍø½ûÇøion materials (PPI ‘Special Index’) | 19.2% | 16.6% | 11.6% | 11.0% | 4.6% |
The ‘service’, ‘commodity’ and ‘energy’ indices (in the middle section of the table) are based on ‘factory-gate’ sales prices.
The ‘input’ indices (at bottom) reflect costs faced by contractors. They exclude capital investment (i.e., machinery & equipment), labor & imports.
The ‘input’ indices are built up from the ‘service’ (design, legal, transport & warehousing, etc.) ‘commodity’ and ‘energy’ indices.
Table: °µÍø½ûÇøConnect.
(Based on Industrial Product Price Index Series from Statistics Canada)
| Year over Year | Latest 3 Months | ||
| Feb 2021/Feb 2020 | Feb 2021/Nov 2020 | ||
| Plastic and foam building and construction materials | -0.3% | 4.4% | |
| Hardwood lumber (except tongue and groove and other edge worked lumber) | 9.2% | 6.0% | |
| Softwood lumber (except tongue and groove and other edge worked lumber) | 103.3% | 48.2% | |
| Wood trusses and engineered wood membersÌý | 5.1% | -0.3% | |
| Veneer and plywoodÌýÌý | 73.7% | 18.7% | |
| Other sawmill products, and treated wood productsÌý | 5.6% | -0.6% | |
| Wood windows and doorsÌýÌý | 1.8% | 1.0% | |
| Wood cabinets and counter topsÌý | 2.1% | 1.4% | |
| Motor gasoline (including blending components and ethanol fuel)ÌýÌý | 1.8% | 33.4% | |
| Diesel and biodiesel fuels | 0.4% | 29.1% | |
| Asphalt (except natural) and asphalt productsÌý | -5.6% | 10.0% | |
| Fabricated steel plate and other fabricated structural metalÌý | 3.9% | 4.4% | |
| Metal valves and pipe fittings (except industrial valves) and enamelled metal sanitary wareÌý | -1.3% | -0.4% | |
| Metal windows and doorsÌý | 3.8% | 3.4% | |
| ±á²¹°ù»å·É²¹°ù±ðÌýÌý | -1.8% | -0.3% |
Table: °µÍø½ûÇøConnect.
Alex Carrick is Chief Economist for °µÍø½ûÇøConnect. He has delivered presentations throughout North America on the U.S., Canadian and world construction outlooks. Mr. Carrick has been with the company since 1985. Links to his numerous articles are featured on Twitter , which has 50,000 followers.


Our prices on lumber and plywood are up at least 200% and 300% respectively in the real world. No idea where these statistics come from. They also say inflation is still very low and we are seeing in excess of 10% across the board.