
U.S. Jobs Claw-Back Ratio Doesn’t Budge
The U.S. economy in the kick-off month of 2021 added +49,000 jobs, according to the latest Employment Situation report published by the Bureau of Labor Statistics ().

It should be pointed out, though, that December 2020’s number has now been revised lower by -49,000. Therefore, January’s result for total employment is only +7,000 when compared with December’s level as it originally appeared.
Due to the stalled effort at jobs creation in the latest month, caused by the return-with-a- vengeance of the coronavirus contagion, the U.S. jobs claw-back ratio remained unchanged from December, at 52.1%.
As seen in Table 1, construction is doing better than many of the other sectors in terms of recovering jobs lost during the March-to-April period of last year. ��������ion’s claw-back ratio is 74.7%.
But January was not a good month for construction employment. Rather than perking up, it fell by -3,000 jobs.
Poor Wage Hikes in ��������ion at Odds with Supply Shortage Reports
A feature of the U.S. construction industry that has been notable since last Spring has been how compensation in the sector is not keeping up with earnings gains for ‘all jobs’.
Year-over-year ‘all jobs’ earnings in January were +5.4% hourly and +7.5% weekly. For workers in construction, the respective advances were +2.8% and +3.1%.
The comparison worsens when supervisory personnel are left out of the mix. For ‘all jobs’ excluding bosses, the changes in the latest month were +5.4% and an astounding +8.0% weekly. By comparison, construction worker payment gains appeared anemic at +2.8% and +3.3%.
The all-jobs earnings advances are receiving a boost from the high level of unemployment among lower-paid workers, which removes them from the wage-jump calculation. Nevertheless, the relatively poor wage hikes being experienced by construction employee is at odds with reports of continuing labor shortages in the sector.
Low supply relative to decent demand usually leads to a bidding up of prices (e.g., wages), especially when that’s what competitors (in this case, sectors other than construction) are doing. ��
Table 1: Monitoring the U.S. Employment Recovery – January 2021
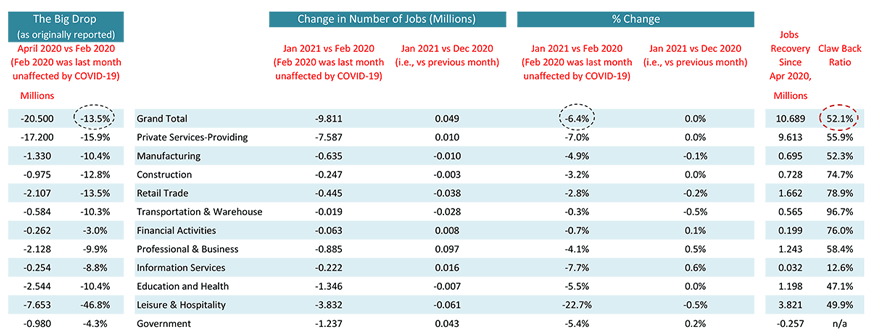
Chart: ��������Connect.
In the Cold of Winter, Canada Drops the ‘Jobs Creation’ Ball
The U.S. may be a little disappointed by its failure to achieve a significant total-jobs advance in January, but what must Canada be thinking? North of the border, was a dismal -213,000 jobs.
The Canadian jobs claw-back ratio, which was a bit of a feel-good story a month ago when it sat at nearly 80%, has now deteriorated to just under 70%.
There was one bit of encouragement to take from the latest Statistics Canada stats. The big drop in total employment was all in part-time work (-225,000 jobs). Full-time work, which is generally regarded as better for the economy overall (i.e., since it’s usually more stable and pays more), was up by +12,000.
The number of full-time jobs in Canada is now -2.8% year over year, while the part-time figure is -12.5% y/y. The disappearing part-time jobs are largely in ‘accommodation and food services’, where the year-over-year record of employment has steepened to deeper than -30%.
Canadian construction jobs in January surprised on the upside. They were +39,000. On a month-to-month basis, they rose by +2.8%. Year-over-year, though, they’re still down, by -4.1%.
Before closing, and letting the following charts tell their own stories, there’s one other sector that warrants commentary, manufacturing.
In January, the number of manufacturing jobs in both the U.S. and Canada shrank by almost the same number, -10,000 and -12,000 respectively. The U.S. figure looks less chilly when the nine times difference in the population between the two countries is factored in.
Nevertheless, Canada’s year-over-year performance in manufacturing jobs is currently beating its American counterpart, +0.9% to -4.5%.
Table 2: Monitoring the Canadian Employment Recovery ‒ January 2021
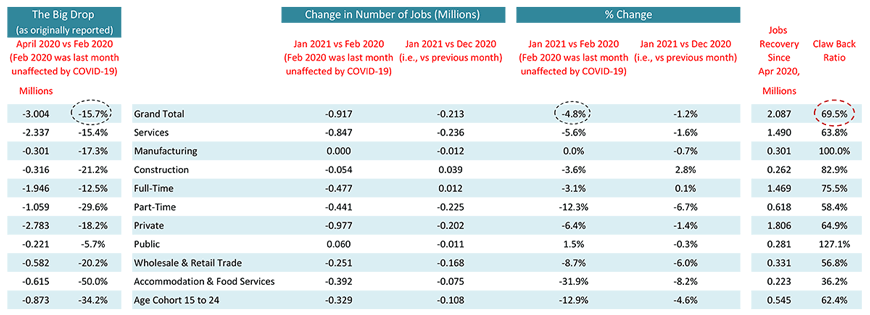
Table: ��������Connect.
Table 3: U.S. and Canadian Jobs Markets – January 2021
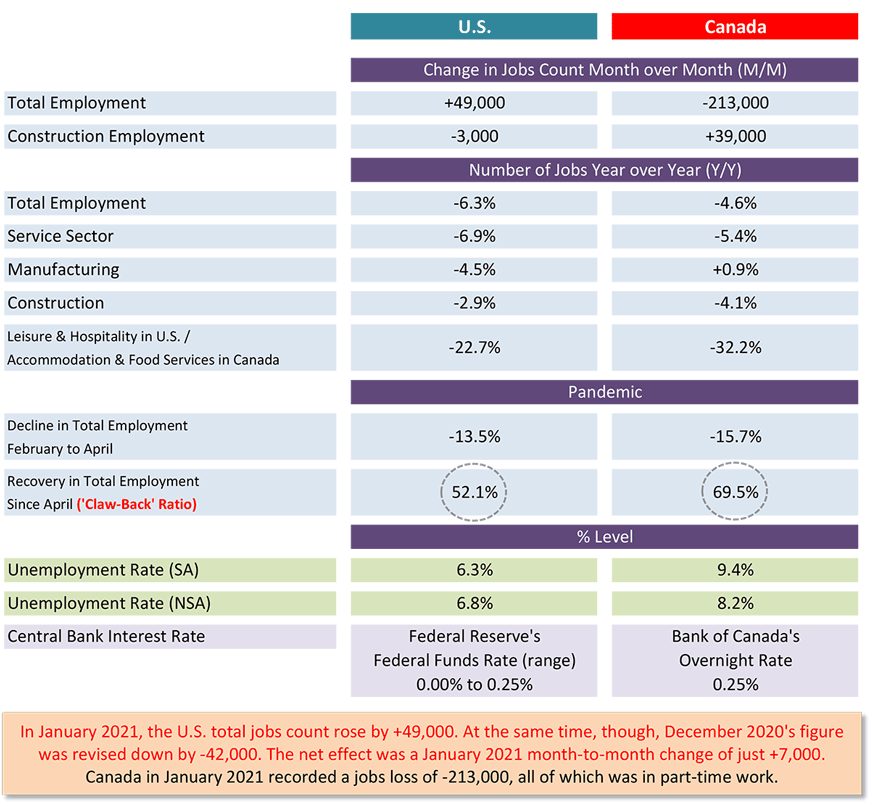
U.S. labor data is from a ‘payroll survey’ / Canadian labour data is from a ‘household survey’.
Canadian NSA unemployment rate ‘R3’ is adjusted to U.S. concepts (i.e., it adopts U.S. equivalent methodology).
Table: ��������Connect.
Graph 1: Y/Y Jobs Change, U.S. Total Industry & Major Subsectors − January 2021
(based on seasonally adjusted payroll data)
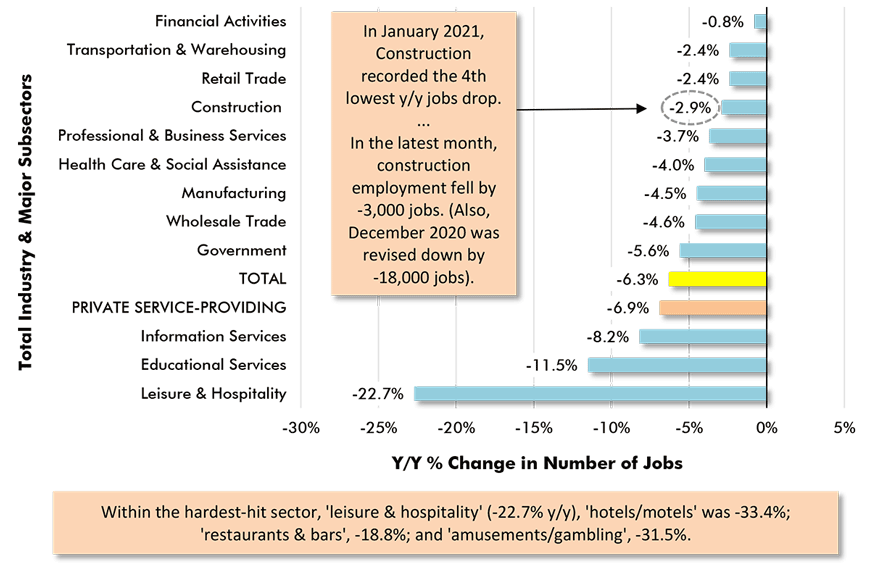
Chart: ��������Connect.
Graph 2: U.S.: Month-to-month Total Jobs Creation
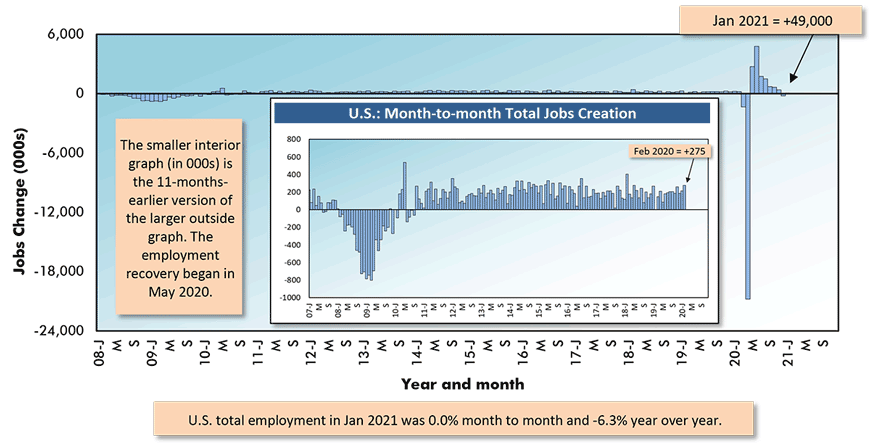
Chart: ��������Connect.
Graph 3: Canada: Month-to-month Total Employment Change
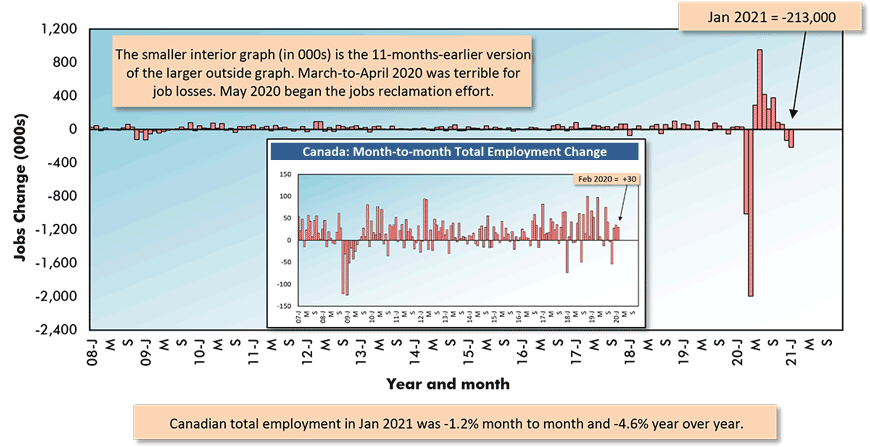
Table: ��������Connect.
Alex Carrick is Chief Economist for ��������Connect. He has delivered presentations throughout North America on the U.S., Canadian and world construction outlooks. Mr. Carrick has been with the company since 1985. Links to his numerous articles are featured on Twitter , which has 50,000 followers.


Recent Comments
comments for this post are closed